Panorama simplifies data tracking and the management of both large and small-scale Cloudhouse Guardian (Guardian) deployments. The core Panorama dashboard is designed to highlight key data elements within your Guardian landscape, whether that data is pulled from one or multiple appliances. As part of this feature, you can choose what organizations you'd like to populate your unique Panorama dashboard with, for centralized access and monitoring.
Note: This feature was introduced in V4.3.49.1 of Guardian. For more information, see October 2024 Quarterly Release. The most recent release for this feature was the December 2024 Monthly Release.
In addition, with Landscape Search you can easily search across your Guardian landscape to view and access node information, regardless of where it is stored. In a multi-appliance deployment, Landscape Search alleviates the complexity of searching for node information and data, by allowing you to search across multiple appliances using one set of credentials. The Panorama dashboard offers a new user experience of Guardian, by bringing together key data sets and presenting them in one centralized location. Even for single application deployments, this new dashboard provides unique value and insight into your Guardian landscape.
Tip: This is an optional feature. To enable this feature, contact your Cloudhouse Representative.
If the feature is enabled, the Dashboard button is displayed on your Guardian home page, linking to your deployed instance of Panorama. Click the link to access your instance of Panorama. You will then be prompted to sign in, see below for more information.
Note: If Panorama is not enabled, the button is grayed out and unable to select. Hovering your cursor over the button will display the following text, 'Contact your support engineer to enable this feature'.
Sign In to Panorama
To access your Panorama dashboard, you need to sign in using a separate account. During the feature enablement process, an account for the primary administrator is set up. The primary administrator is then responsible for inviting users to join Panorama. If you are invited to create an account for Panorama, you will receive a link to set up your account via email. The following process assumes that you have already set up a Panorama account.
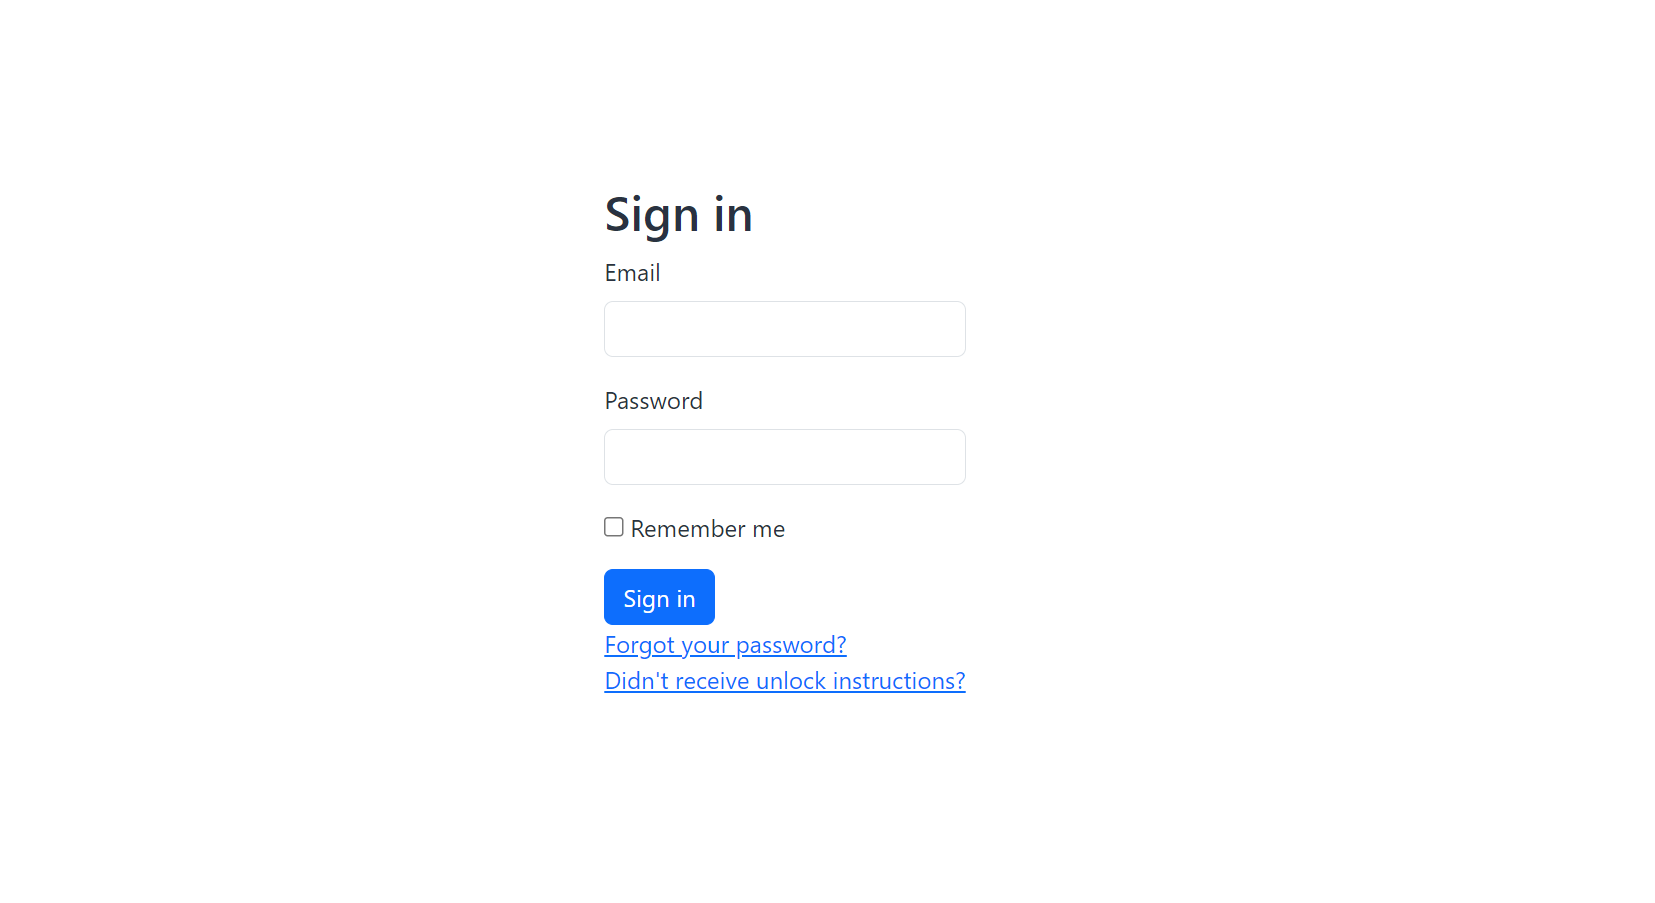
Enter the Email and Password for your account in the fields provided. Then, click to Sign in. The Panorama dashboard is then displayed, see below for more information on the functionality included in this service.
Tip: If you enter the wrong account details five times in a row, your account is temporarily locked for security purposes. Instructions on how to unlock your account are then sent to the email provided. If you do not receive unlock instructions, however, you can click the Didn't receive unlock instructions? hyperlink to display the Resend unlock instructions page. Here, you can enter your email in the field to resend unlock instructions to the correct address.
Dashboard
The source(s) of the information displayed on the Panorama dashboard is determined during the feature enablement process. During this process, the designated Panorama administrator will work with their Cloudhouse Representative to determine the organization accounts they want to be added to the Panorama dashboard for centralized management and monitoring. The organizations can be pulled from multiple separate Guardian deployments, your most frequently used organizations, or every organization you currently have. Once set up, the dashboard is populated with information pulled from the selected organization's database(s).
Tip: All of the information within Panorama is read-only. If you choose to add multiple organizations to your dashboard, there may be some users who do not have access to certain content within Guardian. In this scenario, they can still view the information in Panorama, but clicking to view more information within Guardian will prompt the user to sign in. They are required to provide credentials with appropriate permissions to access the corresponding page(s).
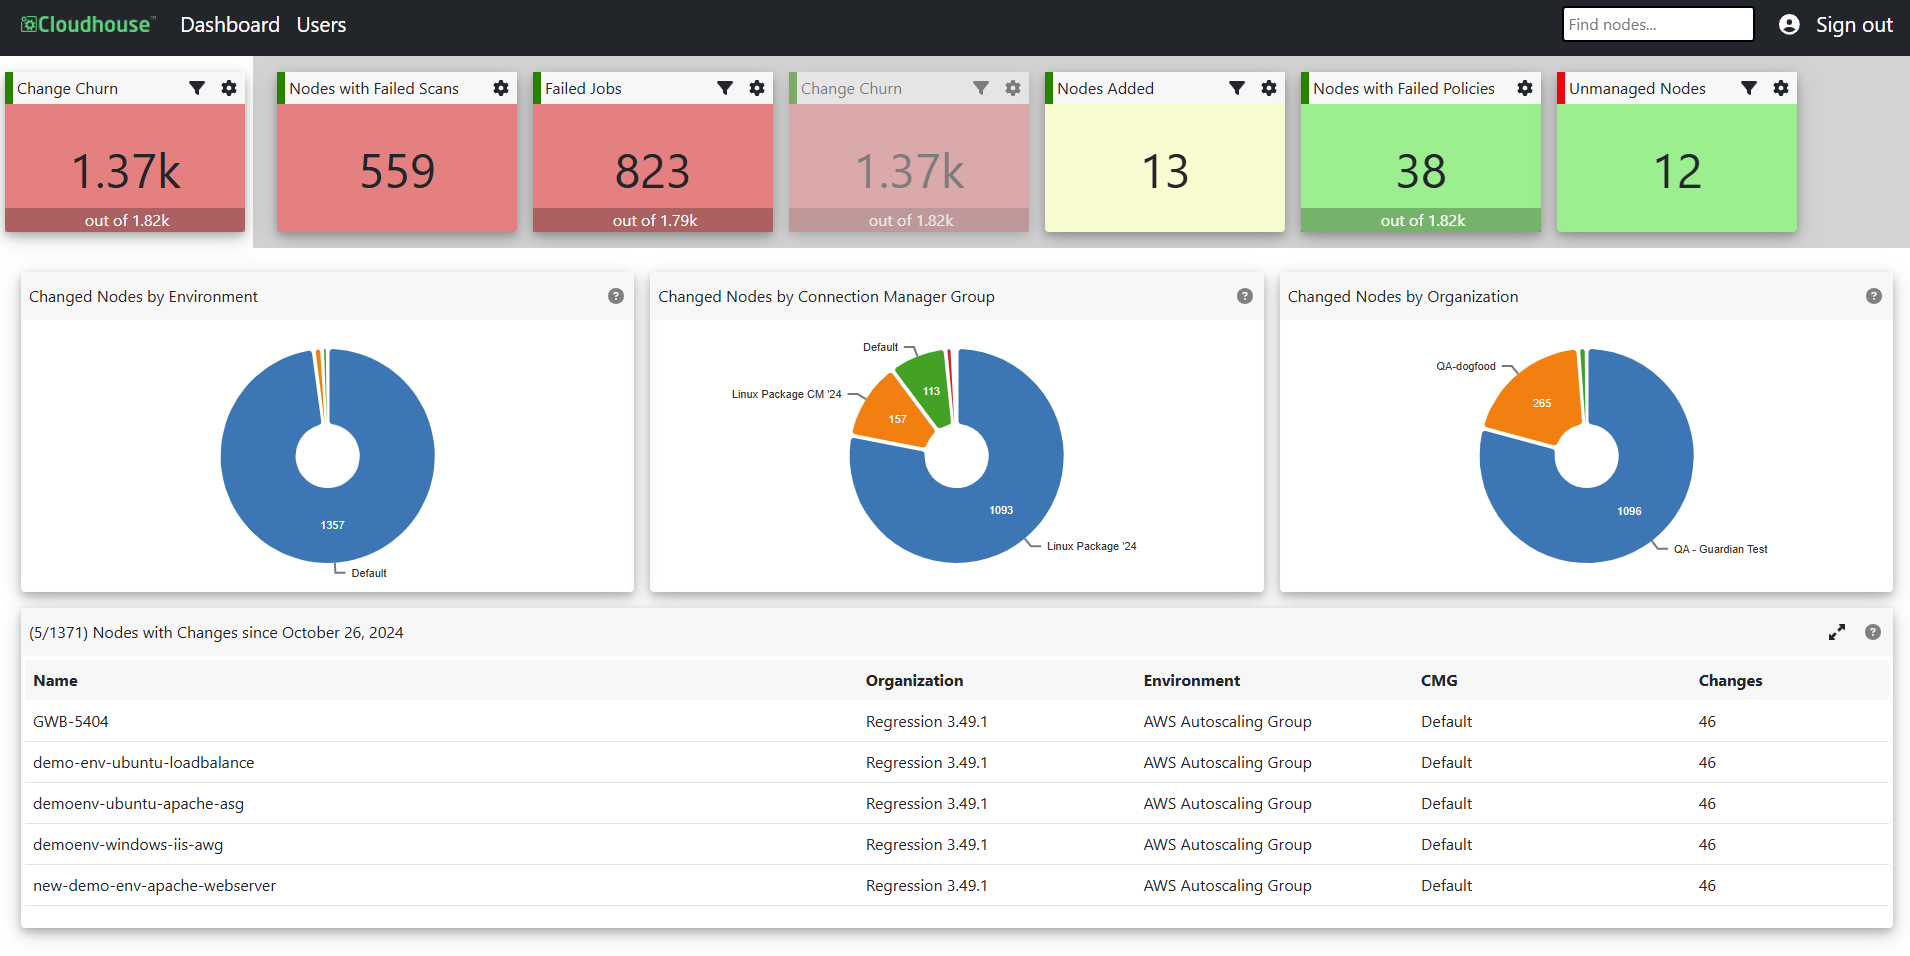
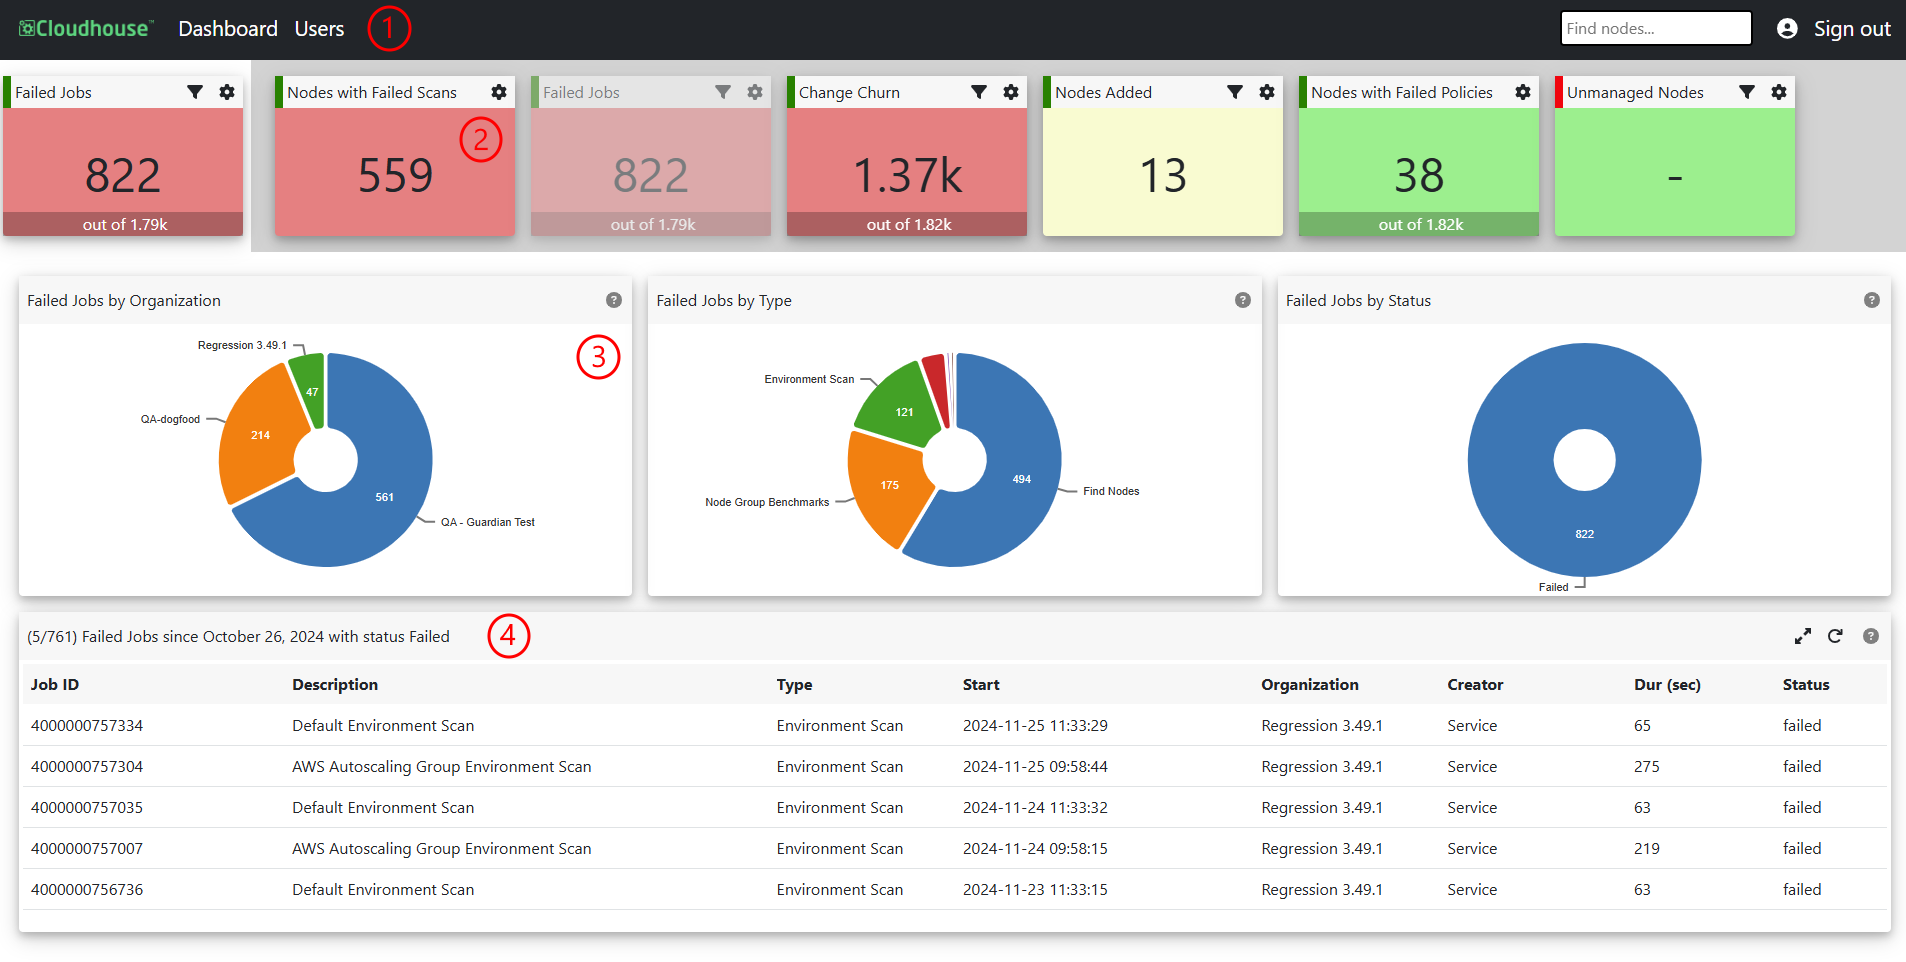
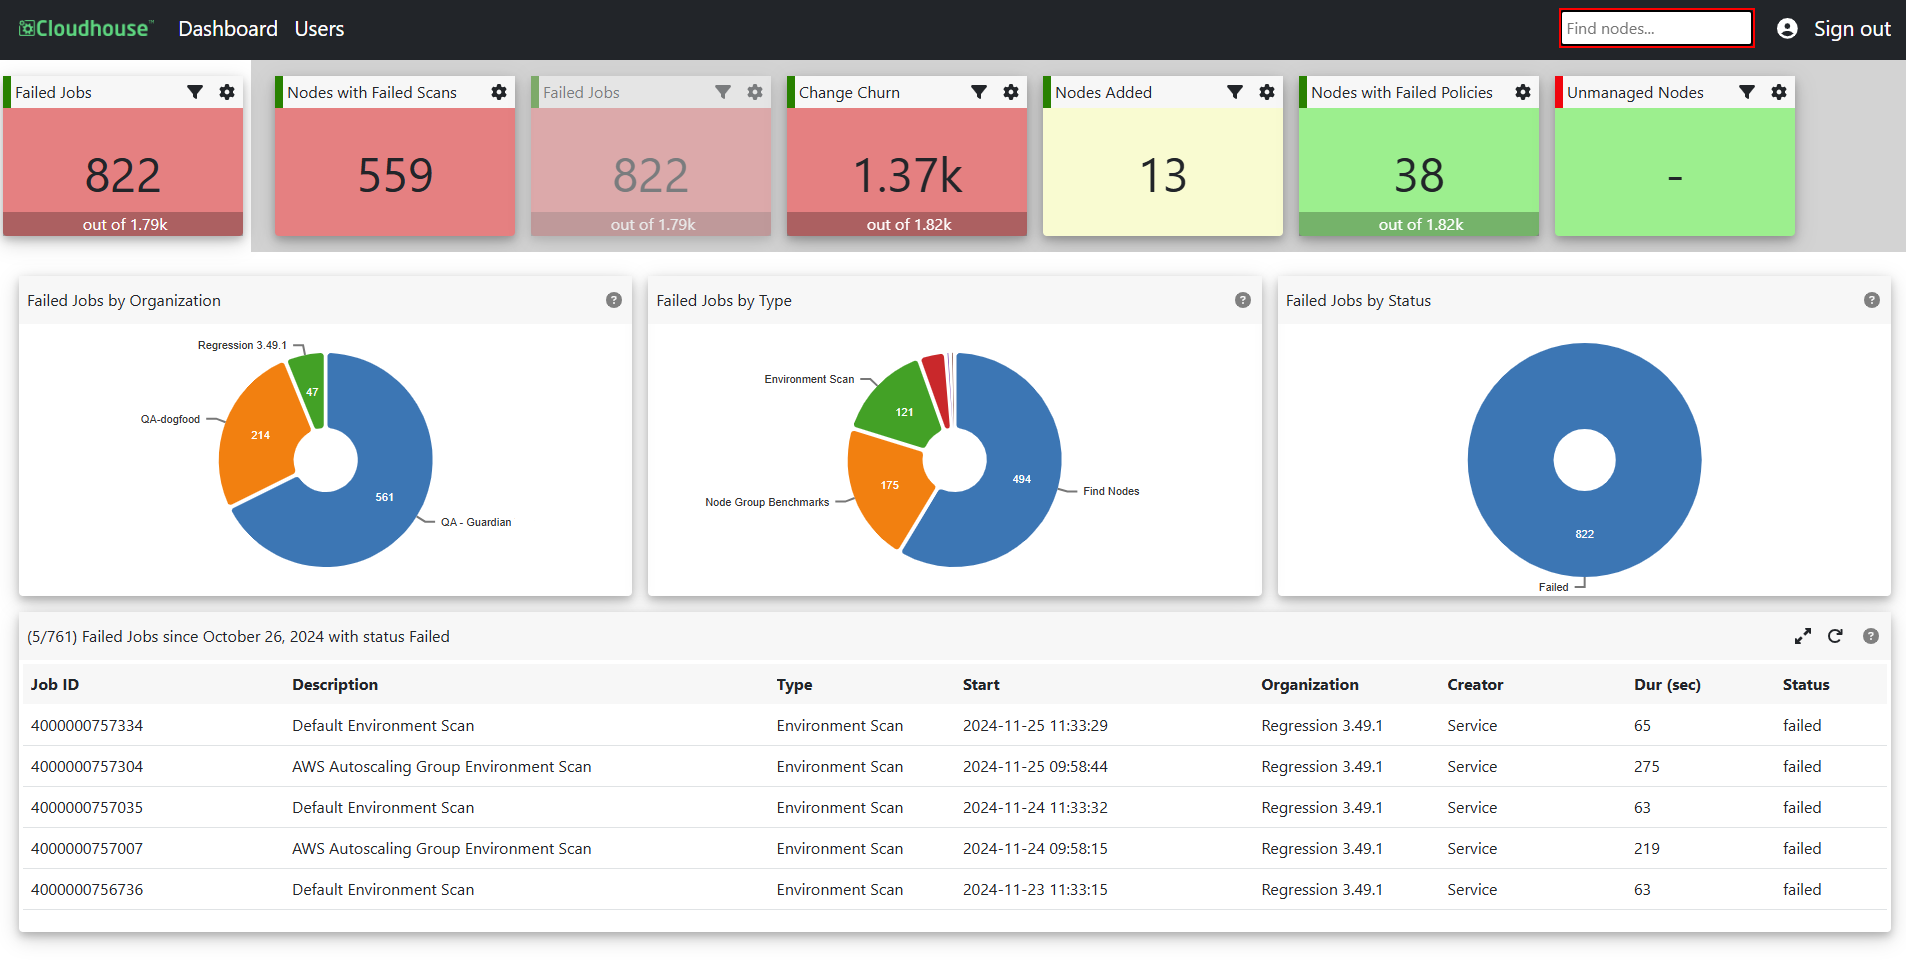
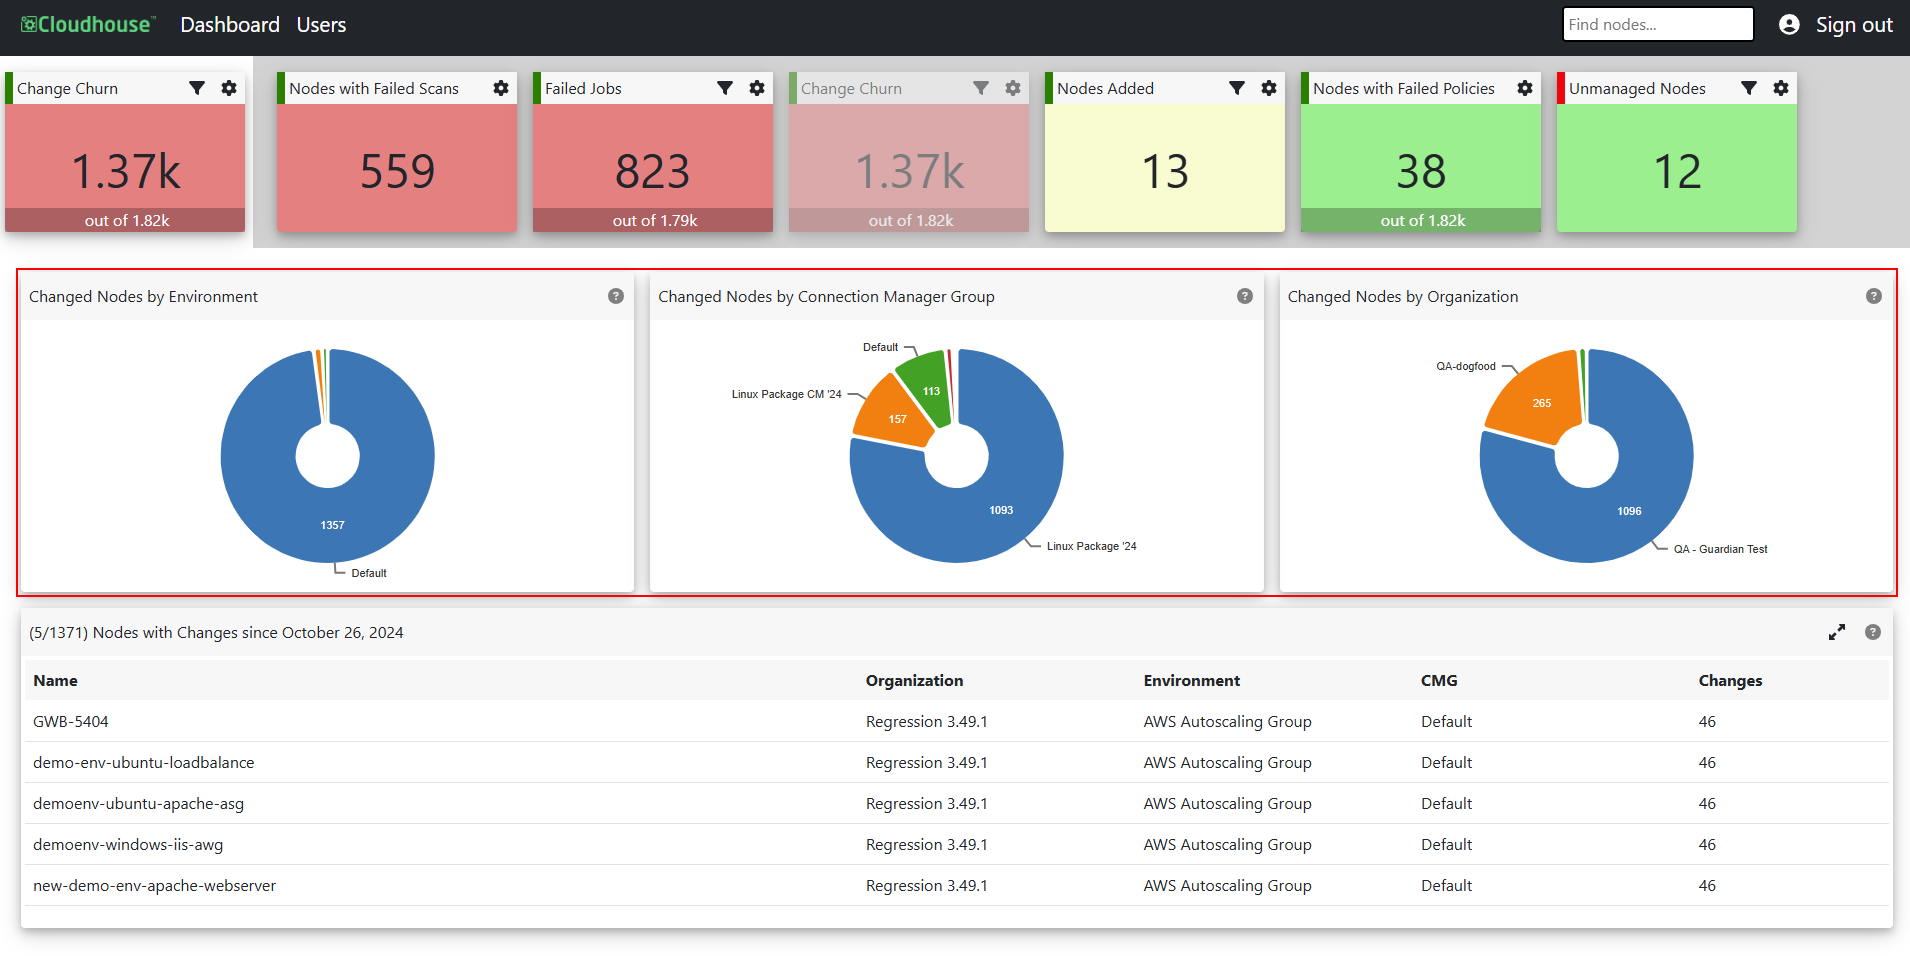
The Panorama dashboard has four basic components, as demonstrated in the above screenshot:
-
Banner – The banner contains a search bar with landscape search capabilities (the ability to search for nodes across all of the organizations within your Panorama instance), as well as the option to Sign Out. For more information on the Panorama landscape search feature, see Landscape Search.
-
Data Indicator – There are five indicators on the Panorama dashboard, each displaying the number of records returned by a specific data set. For example, the number of nodes with failed policies. The results can be filtered by organizational unit (Environment, Connection Manager group, etc.), event date (past ten days, thirty days, etc.), and more. Select an indicator to populate the data visualization and/or results table with information related to that data set. For more information, see Data Indicator.
Tip: Each indicator is assigned a status: critical (red), warning (yellow), or passing (green). The status is determined by a threshold count. You can configure the threshold for each status within the individual indicator's settings, see Indicator Settings for more information.
-
Data Visualization – Visual breakdown of the data contained in a selected indicator. For example, a pie chart displaying a breakdown of nodes added by environment, Connection Manager group, or organization. For more information, see Data Visualization.
-
Results Table – A list of results returned by the data query. For example, the number of nodes with policies that failed within the last seven days for a specific environment. For more information, see Results Table.
Landscape Search
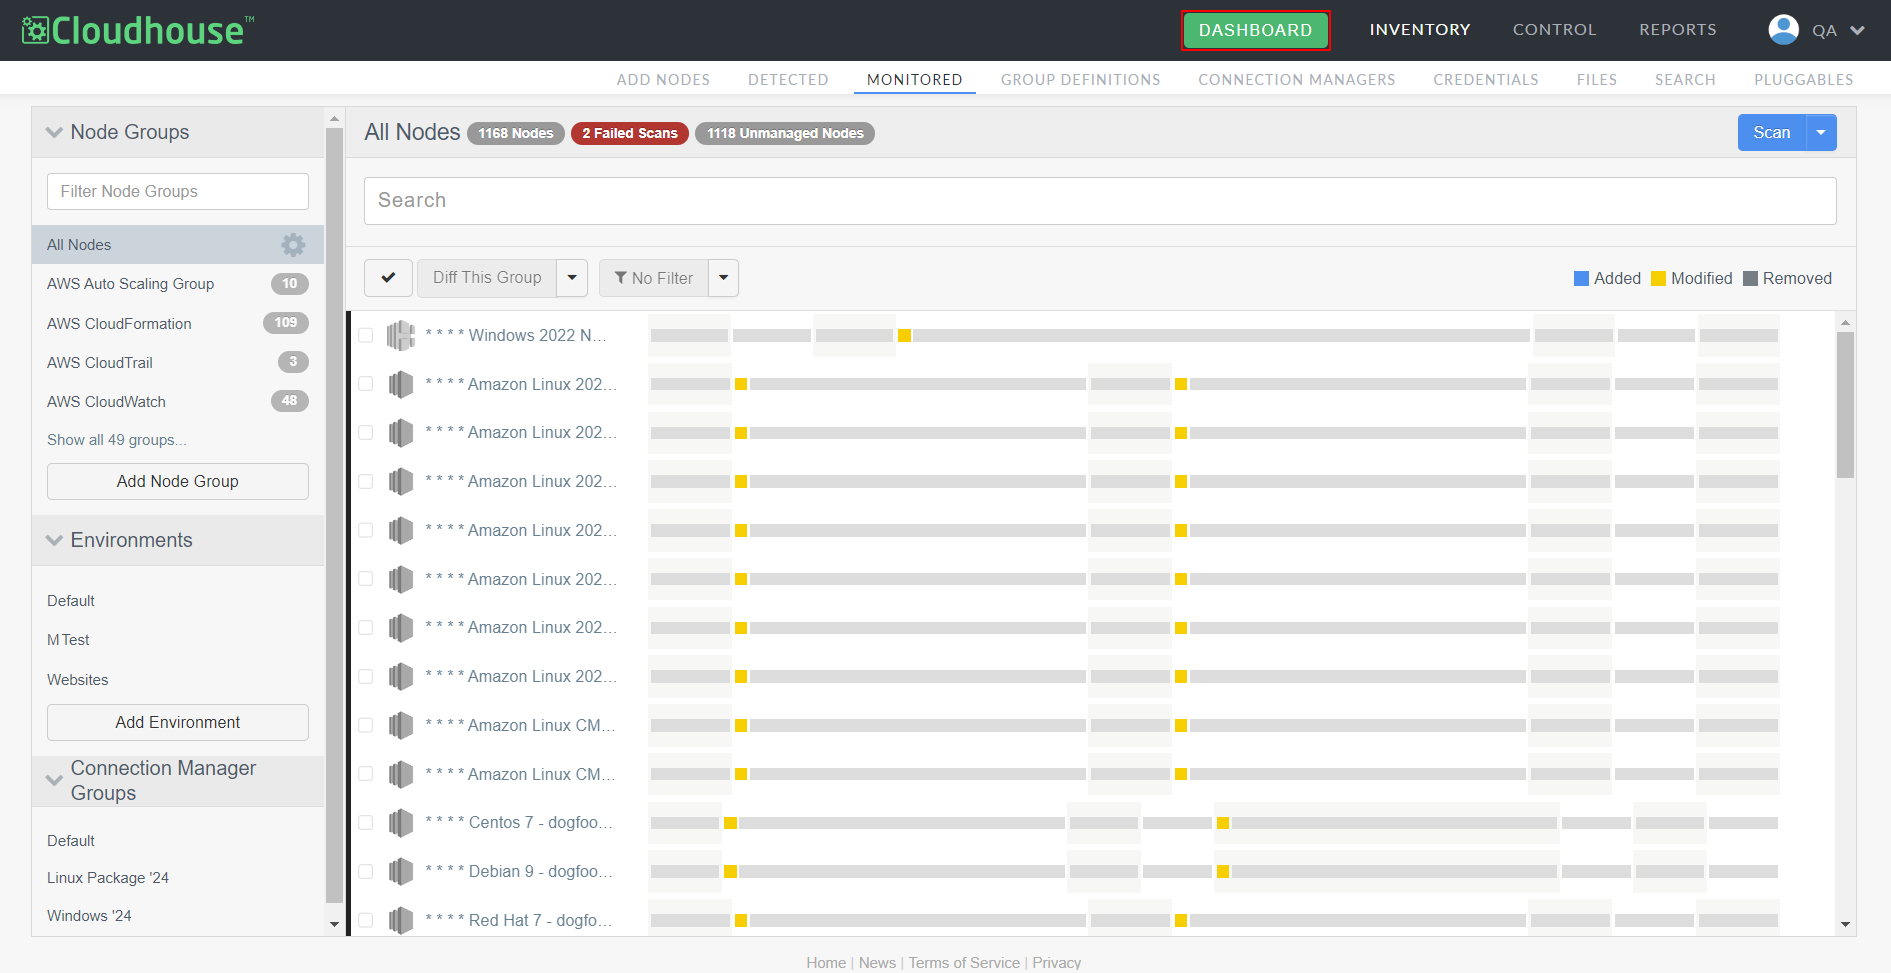
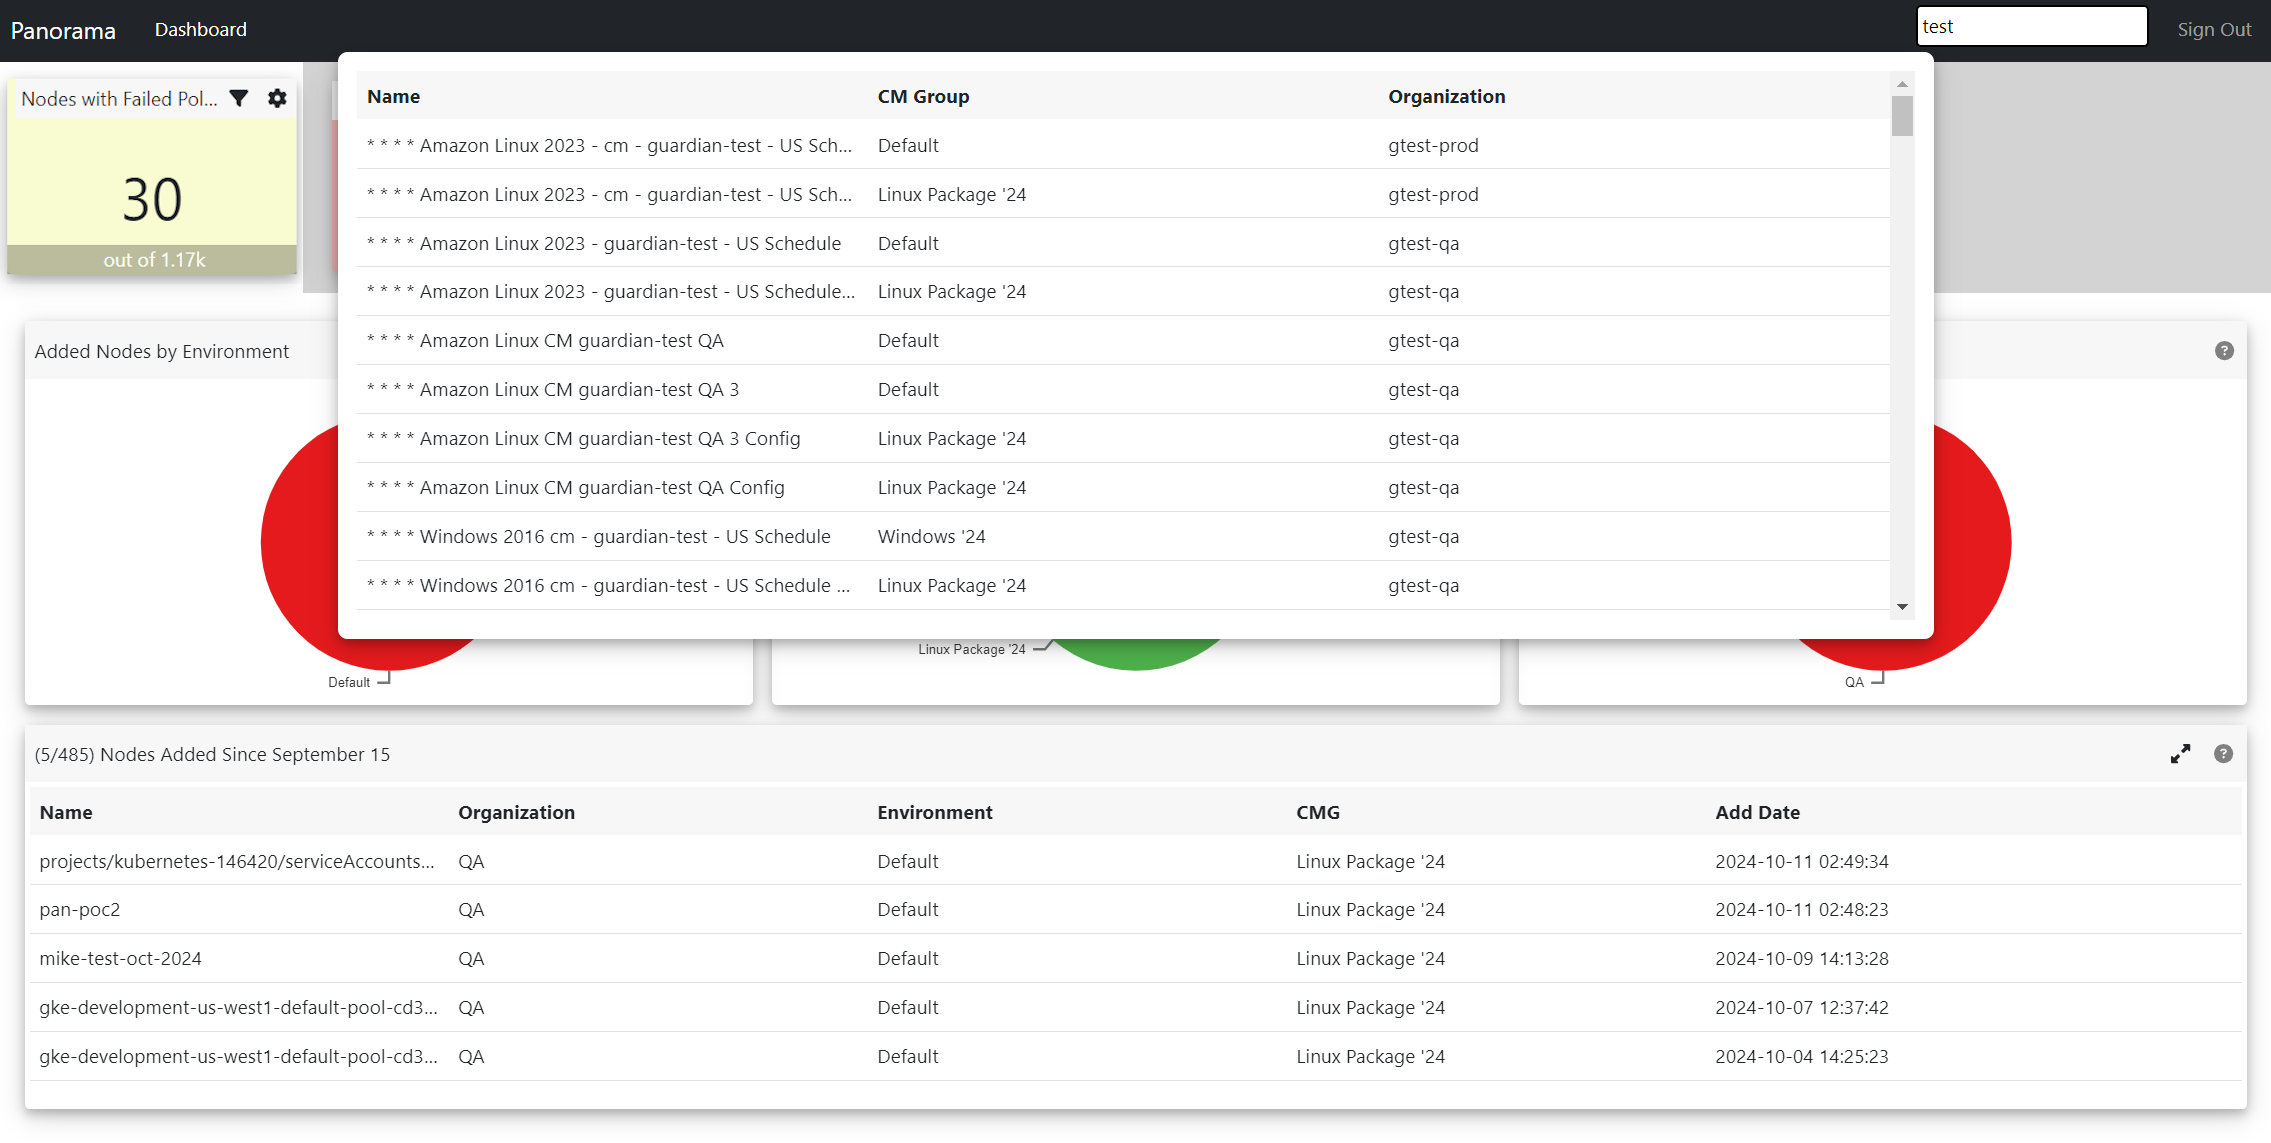
Located in the banner at the top of the page, the landscape search bar in Panorama allows you to search for nodes across each of the organizations within your dashboard. This feature was introduced to alleviate the complexity of searching for nodes across multiple deployments of Guardian.
To use this feature, enter a value in the Find nodes... search bar at the top of the page. Any nodes that match the value you entered are automatically displayed in a table of results, alongside the node name, Connection Manager group, and organization it is stored in.
Note: You need to type at least three characters for results to be populated in the table.
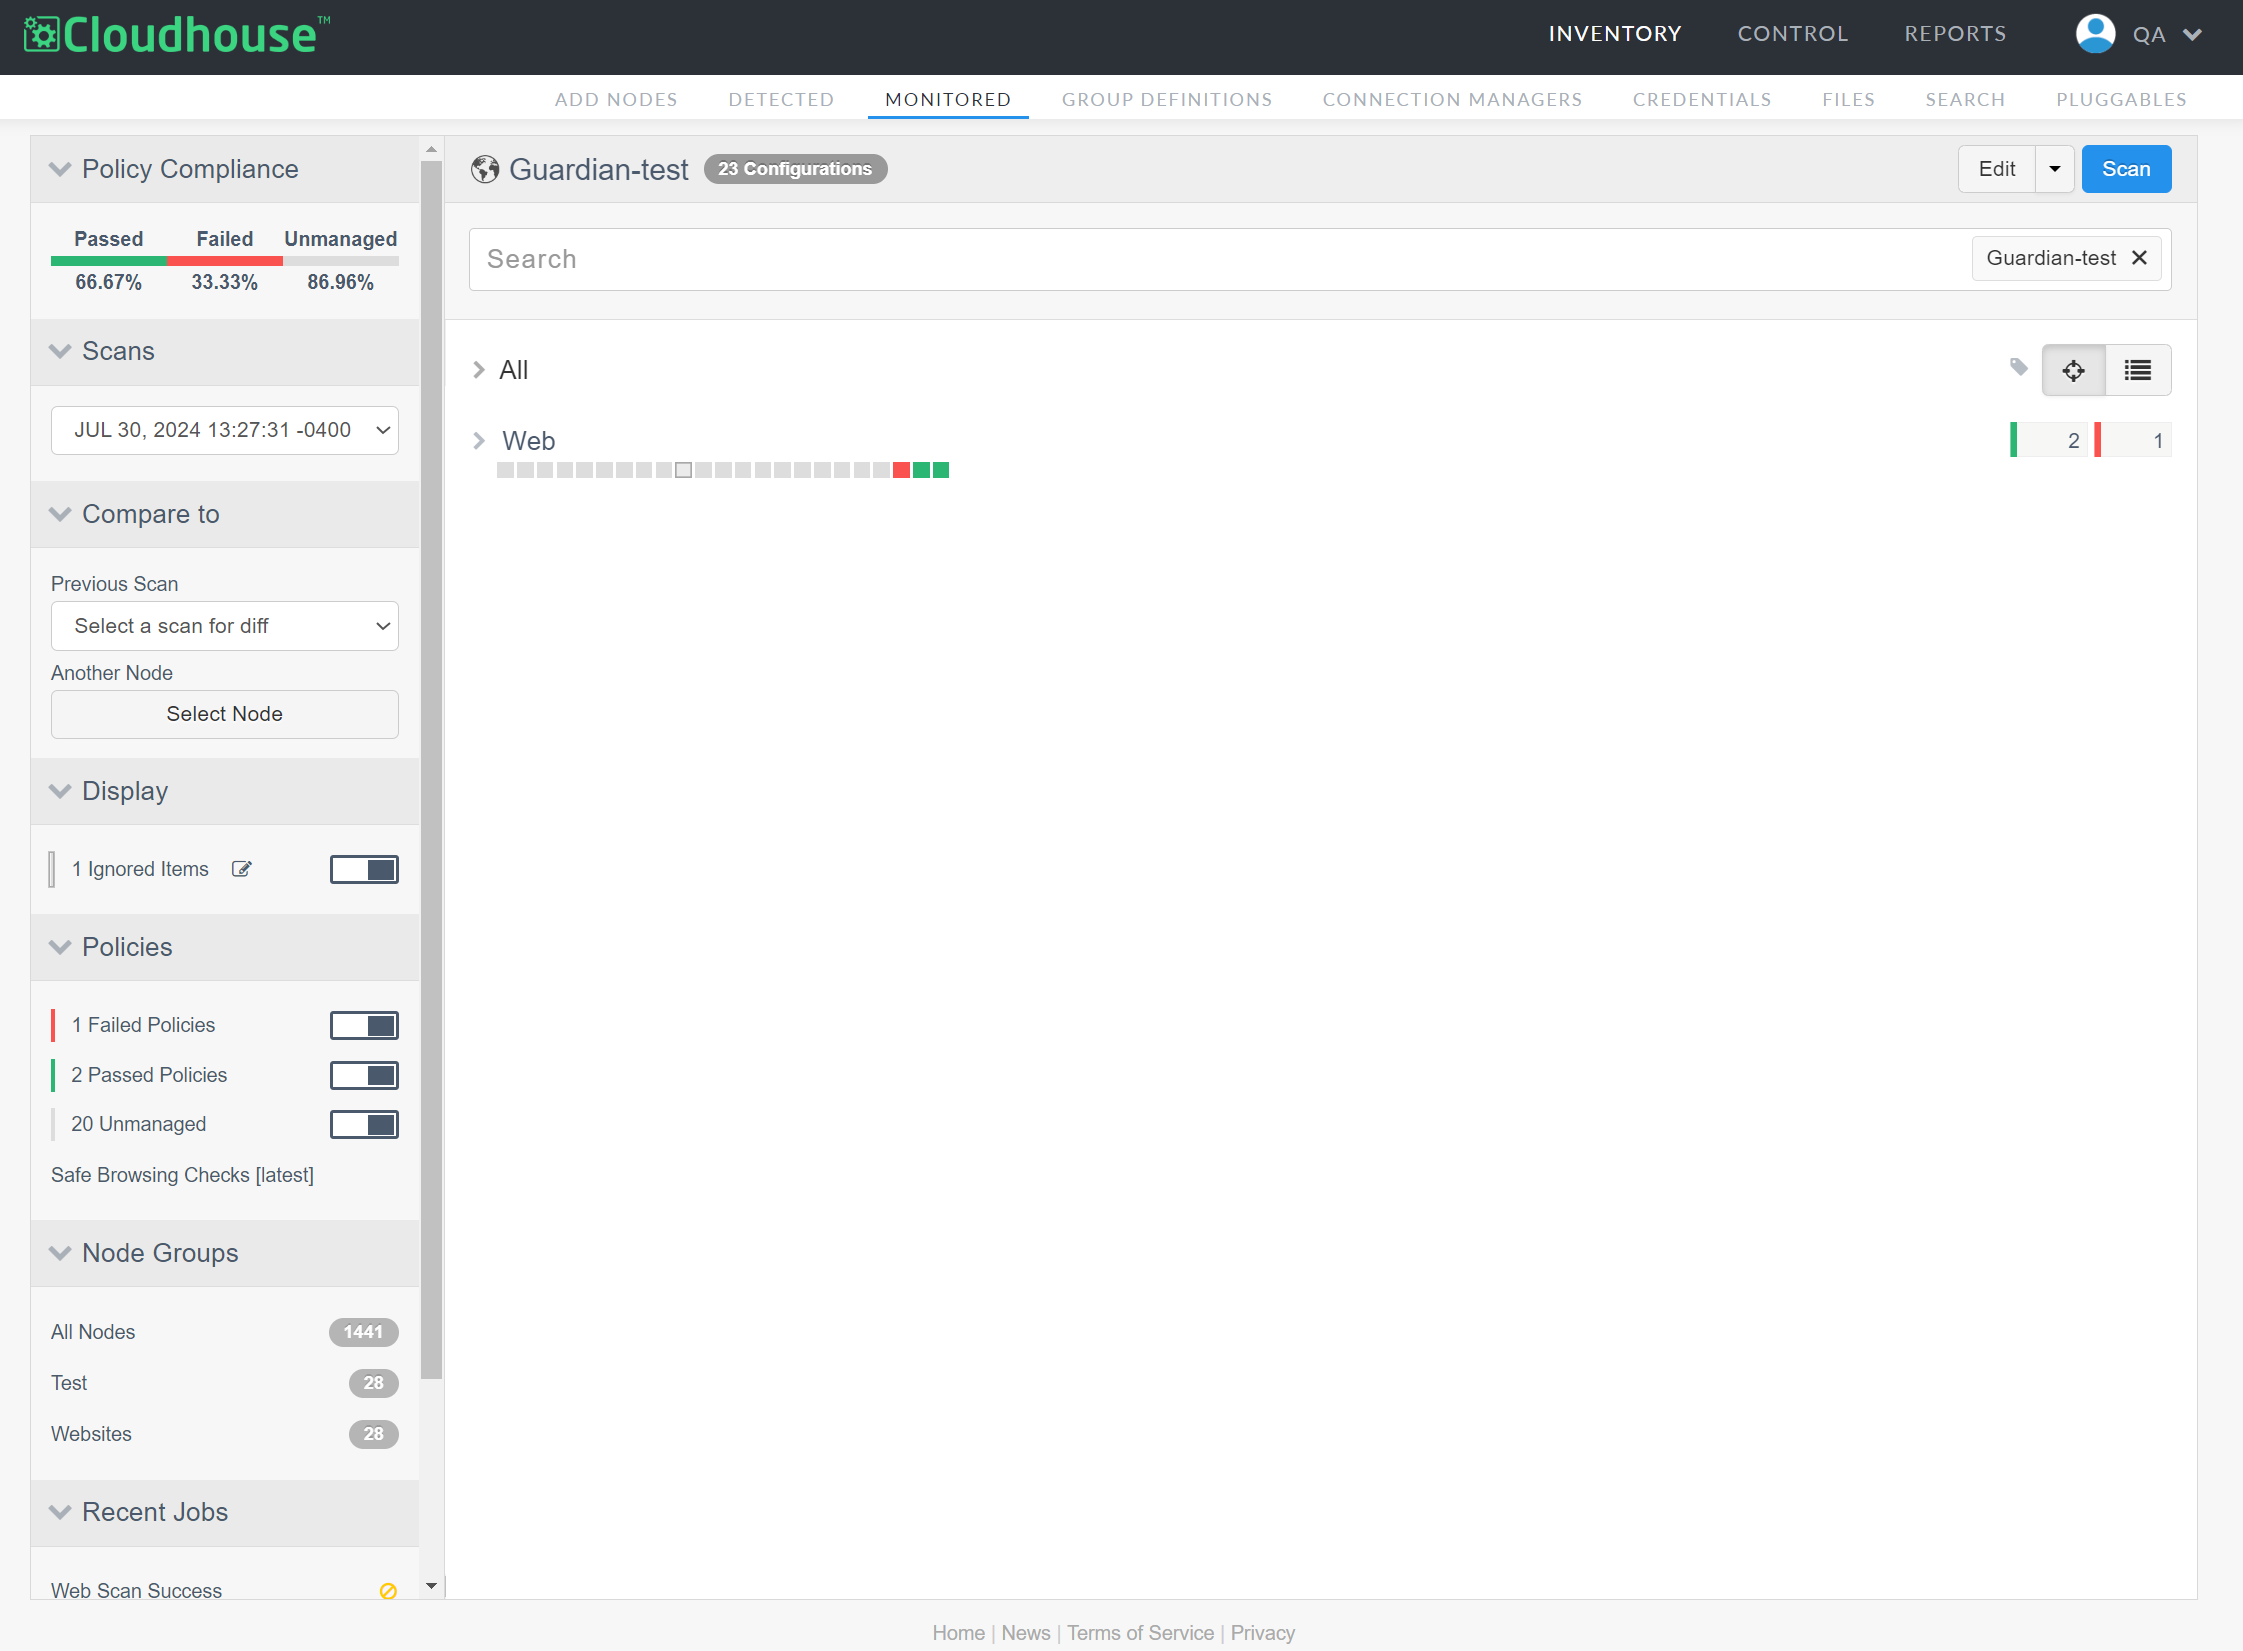
Select a record from the table to display the results of the selected node's most recent scan. The node scan results page is displayed in new tab within the corresponding instance of Guardian that stores the selected node's data. Here, you can begin to investigate the condition of the node as usual in Guardian. For more information on this page, see Node Scan Results.
Tip: If the node has not been scanned before, a message stating 'Node Has Never Been Scanned' is displayed, with the option to Scan Now.
Data Indicator
A data indicator is a configurable element used to define the threshold for a critical (red), warning (yellow), or passing (green) state for the six data sets within Panorama.

The following indicators are populated with data from each of your Guardian organizations:
-
Nodes Added – Number of nodes that have been added within the last X amount of days.
-
Nodes with Failed Scans – Number of scan jobs that have failed on nodes within the last X amount of days.
-
Unmanaged Nodes – Number of nodes that do not have a policy defined.
-
Failed Jobs – Number of jobs that were canceled or failed within the last X amount of days due to one or more tasks failing.
-
Nodes with Failed Policies – Number of policies that have run on nodes and failed, due to one or more checks failing.
-
Change Churn – Number of nodes that have experienced changes within the last X amount of days.
Note: The Change Churn indicator was introduced in V1.1 of the Panorama dashboard. For more information, see December 2024 Monthly Release.
By default, each indicator displays the total number of records returned for that specific data set. For best results, we encourage you to define the threshold for an actionable state within the Indicator Settings. For example, when the number of Failed Jobs exceeds 500, the indicator turns yellow (warning), indicating that action may be required to prevent further outages. Additionally, you can filter the results for each indicator within the Data Visualization section. The results in the table below are updated accordingly.
Data Request Status
Alongside the configurable statuses, each indicator has a health bar that is displayed to the left of the title, indicating whether the attempted connection to your Guardian appliance was successful. To ensure that your dashboard displays both accurate and up-to-date information, Panorama sends frequent requests for data to each of the Guardian organizations that are present on your dashboard. The health bar indicates whether any errors were encountered during the data request (for each organization).

When an indicator attempts to pull data from Guardian, depending on whether an error was received (by one or more organizations), one of the following statuses are assigned:
-
Success (Green) – The data request was successfully received and returned for each organization. The indicator data set is updated and displayed accordingly.
-
Partial Failure (Amber) – The data request was successfully received by at least one organization, but not all. An error message is displayed for each failed request. The indicator data is updated where applicable and displayed accordingly.
-
Failure (Red) – The data request failed, as none of the organizations were reachable. An error message is displayed for each failed request. The indicator data is not updated.
To ensure that your instance of Panorama is accurate and up-to-date, ensure that each of your indicator's data requests have been successful.
Tip: Each error message provides information on the failed request. Such as, the name of the organization table entry that data could not be pulled from. Cloudhouse advises that you contact your local Guardian Representative to confirm that the Guardian instance named in the error message is active and reachable from the Panorama server. If the server is active and the issue persists, contact your Cloudhouse Representative for support.
Indicator Settings
Each indicator has a selection of settings that should be configured to define the status and output of the data. To access the settings for an indicator, click the Settings button ( ).
).
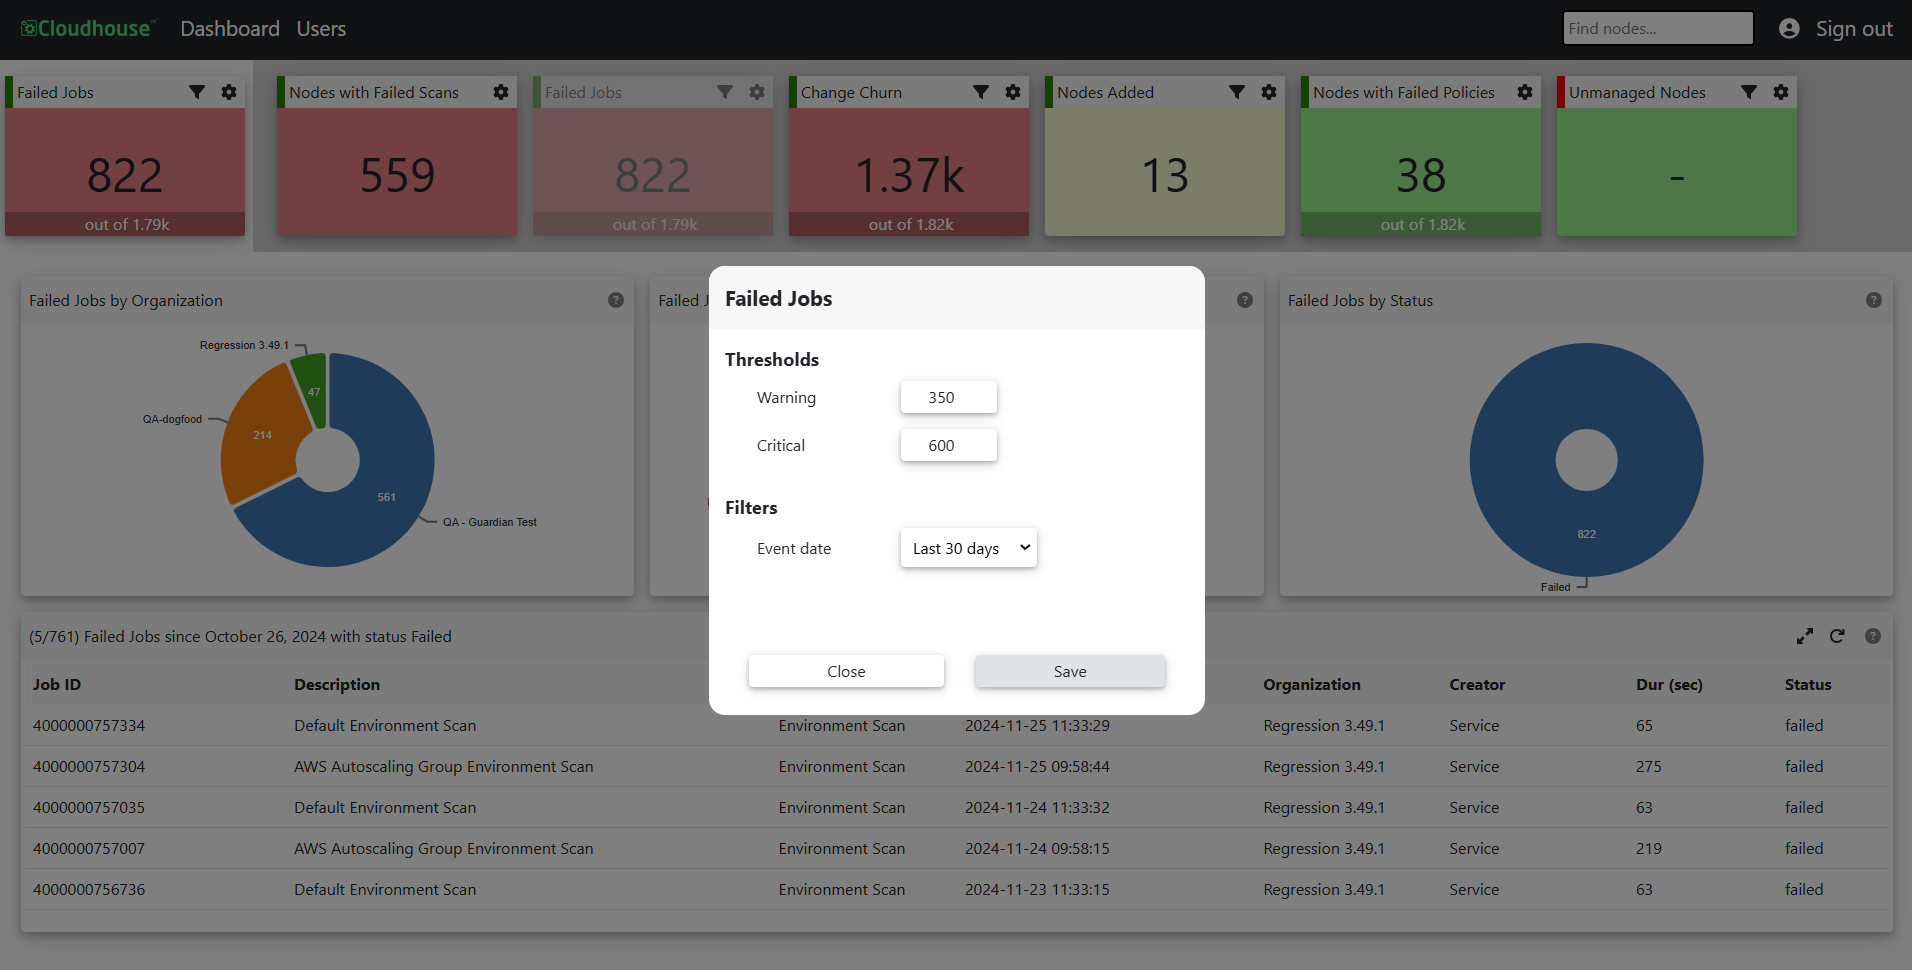
The following options are displayed:
| Setting | Description | Applies to |
|---|---|---|
| Warning threshold field |
The number of records that can be returned before the status is set to a warning and displayed in yellow. Enter a value in the field provided and click Save. Note: Anything below this threshold is passing the acceptability standards and is displayed in green. |
All indicators |
| Critical threshold field |
The number of records that can be returned before the status is set to critical and displayed in red. Enter a value in the field provided and click Save. |
All indicators |
| Event Date drop-down filter |
Option to filter the results according to a date range. Select one of the following values from the drop-down list:
|
Nodes Added, Nodes with Failed Scans, Failed Jobs, Change Churn. |
Once the threshold for each indicator's status has been determined, you can move onto configuring the output. See below for more information.
Tip: As you continue to use the Panorama dashboard, you may find that the threshold for various indicators needs to be changed and updated. You can edit the indicator settings at any time without impacting your output.
Data Visualization
Select an indicator to display a visual breakdown of your data in pie chart format. Each indicator breaks down that data into three categories and most indicators organize data within organizational units (Environments, Connection Manager Group, and Organization) so that you can visually understand where any discrepancies lie. For example, 70% of your Nodes with Failed Policies may be occurring within one environment, and the rest equally divided amongst several other environments in different organizations. The latter is to be expected, but the former indicates a potential issue that may need to be resolved. The full list of nodes or jobs are displayed in the Results Table, however you can select a slice from the pie chart to filter the results according to the selected category.
Note: All indicators, except for Unmanaged Nodes, include a corresponding data visualization. This indicator displays the data returned in a Results Table only.
The following categories are displayed in the data visualization section:
| Category | Description | Applies to |
|---|---|---|
| Environments | The environment that the node or policy is stored in. | All indicators |
| Connection Manager Group | The Connection Manager group that is responsible for scanning the node. | Failed Jobs, Nodes with Failed Policies, Nodes Added, Nodes with Failed Scans, Change Churn |
| Organization | The organization that the node is stored in. | Failed Jobs, Nodes with Failed Policies, Nodes Added, Nodes with Failed Scans, Change Churn |
| Type | The type of job that failed/was canceled. For example, 'Environment Scan'. | Failed Jobs |
| Status | The status of the policy. For example, 'Failed', 'Canceled'. | Failed Jobs |
The full list of nodes or jobs returned by the data query are displayed in the Results Table, however you can select a slice from the pie chart to filter the results according to the selected category, see below for more information.
Results Table
The data returned by each indicator is displayed in a table at the bottom of the dashboard. To filter the results in this table, select an option from the pie chart. The title is updated dynamically, according to any filters that are applied. For example, some indicators are filtered to display results from the last 30 days by default. As such, the factory setting title for the Failed Jobs indicator is '(X/Y) Failed Jobs Since September 24'. If you selected a category to filter from the data visualization section, that would appear as '(X/Y) Failed Jobs Since [date] of type [selected]'.

Select a heading to filter the results in alphabetical order, reverse alphabetical order, or in most recent order. To reset any filters applied, click the Refresh ( ) button. Additionally, to display the full set of results returned by the search query, click the Expand button (
 ).
).